
What Concurrent Player Data Can Reveal About Online Table Games?
By Alex╺
- PS4
- PS5
- XBox One
- Series X
- PC
A player counter looks wonderfully precise. One number appears on a dashboard and seems to describe the size of a game immediately.
In reality, concurrent-user data is a snapshot with a long list of conditions attached. Time zone, table capacity, session length, and platform design can all change what the number means.
Online table games make those complications especially visible. A busy lobby may contain rapid automated tables, streamed dealer rooms, and several rule variants. Counting the people present is easy compared with interpreting why they are there.
Concurrency measures a moment, not an audience
Monthly active users count distinct users or accounts that meet a platform’s defined activity condition during a month. Concurrency asks how many are connected at the same time.
The second figure is valuable for infrastructure planning because servers experience simultaneous demand, but it should not be mistaken for total popularity.
Our analysis of player counts in the sweepstakes gaming market made the same distinction. Sign-ups, active players, and purchasers describe different behaviors. Combining them into one headline number hides more than it reveals.
Public counters need definitions
A number is difficult to interpret when the measurement rules are hidden. Does the counter include people in menus, spectators, or disconnected sessions waiting to recover, or only players seated at a table?
Is it updated continuously or sampled every few minutes? A platform should publish enough methodology for readers to understand what the figure can and cannot represent.
Bot traffic and duplicate connections can complicate the picture further. Operational systems may need to count every active connection for capacity planning, while an audience report wants distinct people. Those are both legitimate measures, but giving them the same label invites false comparisons.
Table design affects the number
A digital blackjack lobby can spread demand across many tables or concentrate it in a few visible rooms. The structure used by Gaming Club online blackjack illustrates why category-level data needs context: several variants may serve similar interests while differing in pace, presentation, and capacity. Looking only at the busiest individual table could understate the audience for the wider category.
Session duration matters too. A title with short visits can attract many people across a day while showing modest concurrency at any instant. A slower live table may display a high steady count even with fewer unique participants.
Time zones reveal market geography
Plotting concurrency through the day can expose where an audience is concentrated. A single evening peak suggests a local or regional base. Several overlapping peaks may indicate international traffic. Weekends, sporting events, and holidays add further texture.
Patterns matter more than isolated peaks
A record high can reflect a promotion, holiday, or technical event rather than sustained growth. Analysts should compare equivalent days and time windows, then examine whether the baseline remains higher after the spike. Trend lines reveal retention more clearly than one screenshot shared at the busiest moment.
Table occupancy adds useful context. High overall concurrency with many nearly empty tables creates a different social experience from the same audience concentrated into fewer rooms.
Operators balance variety against liquidity, ensuring that players can find the format they want without making every room appear deserted.
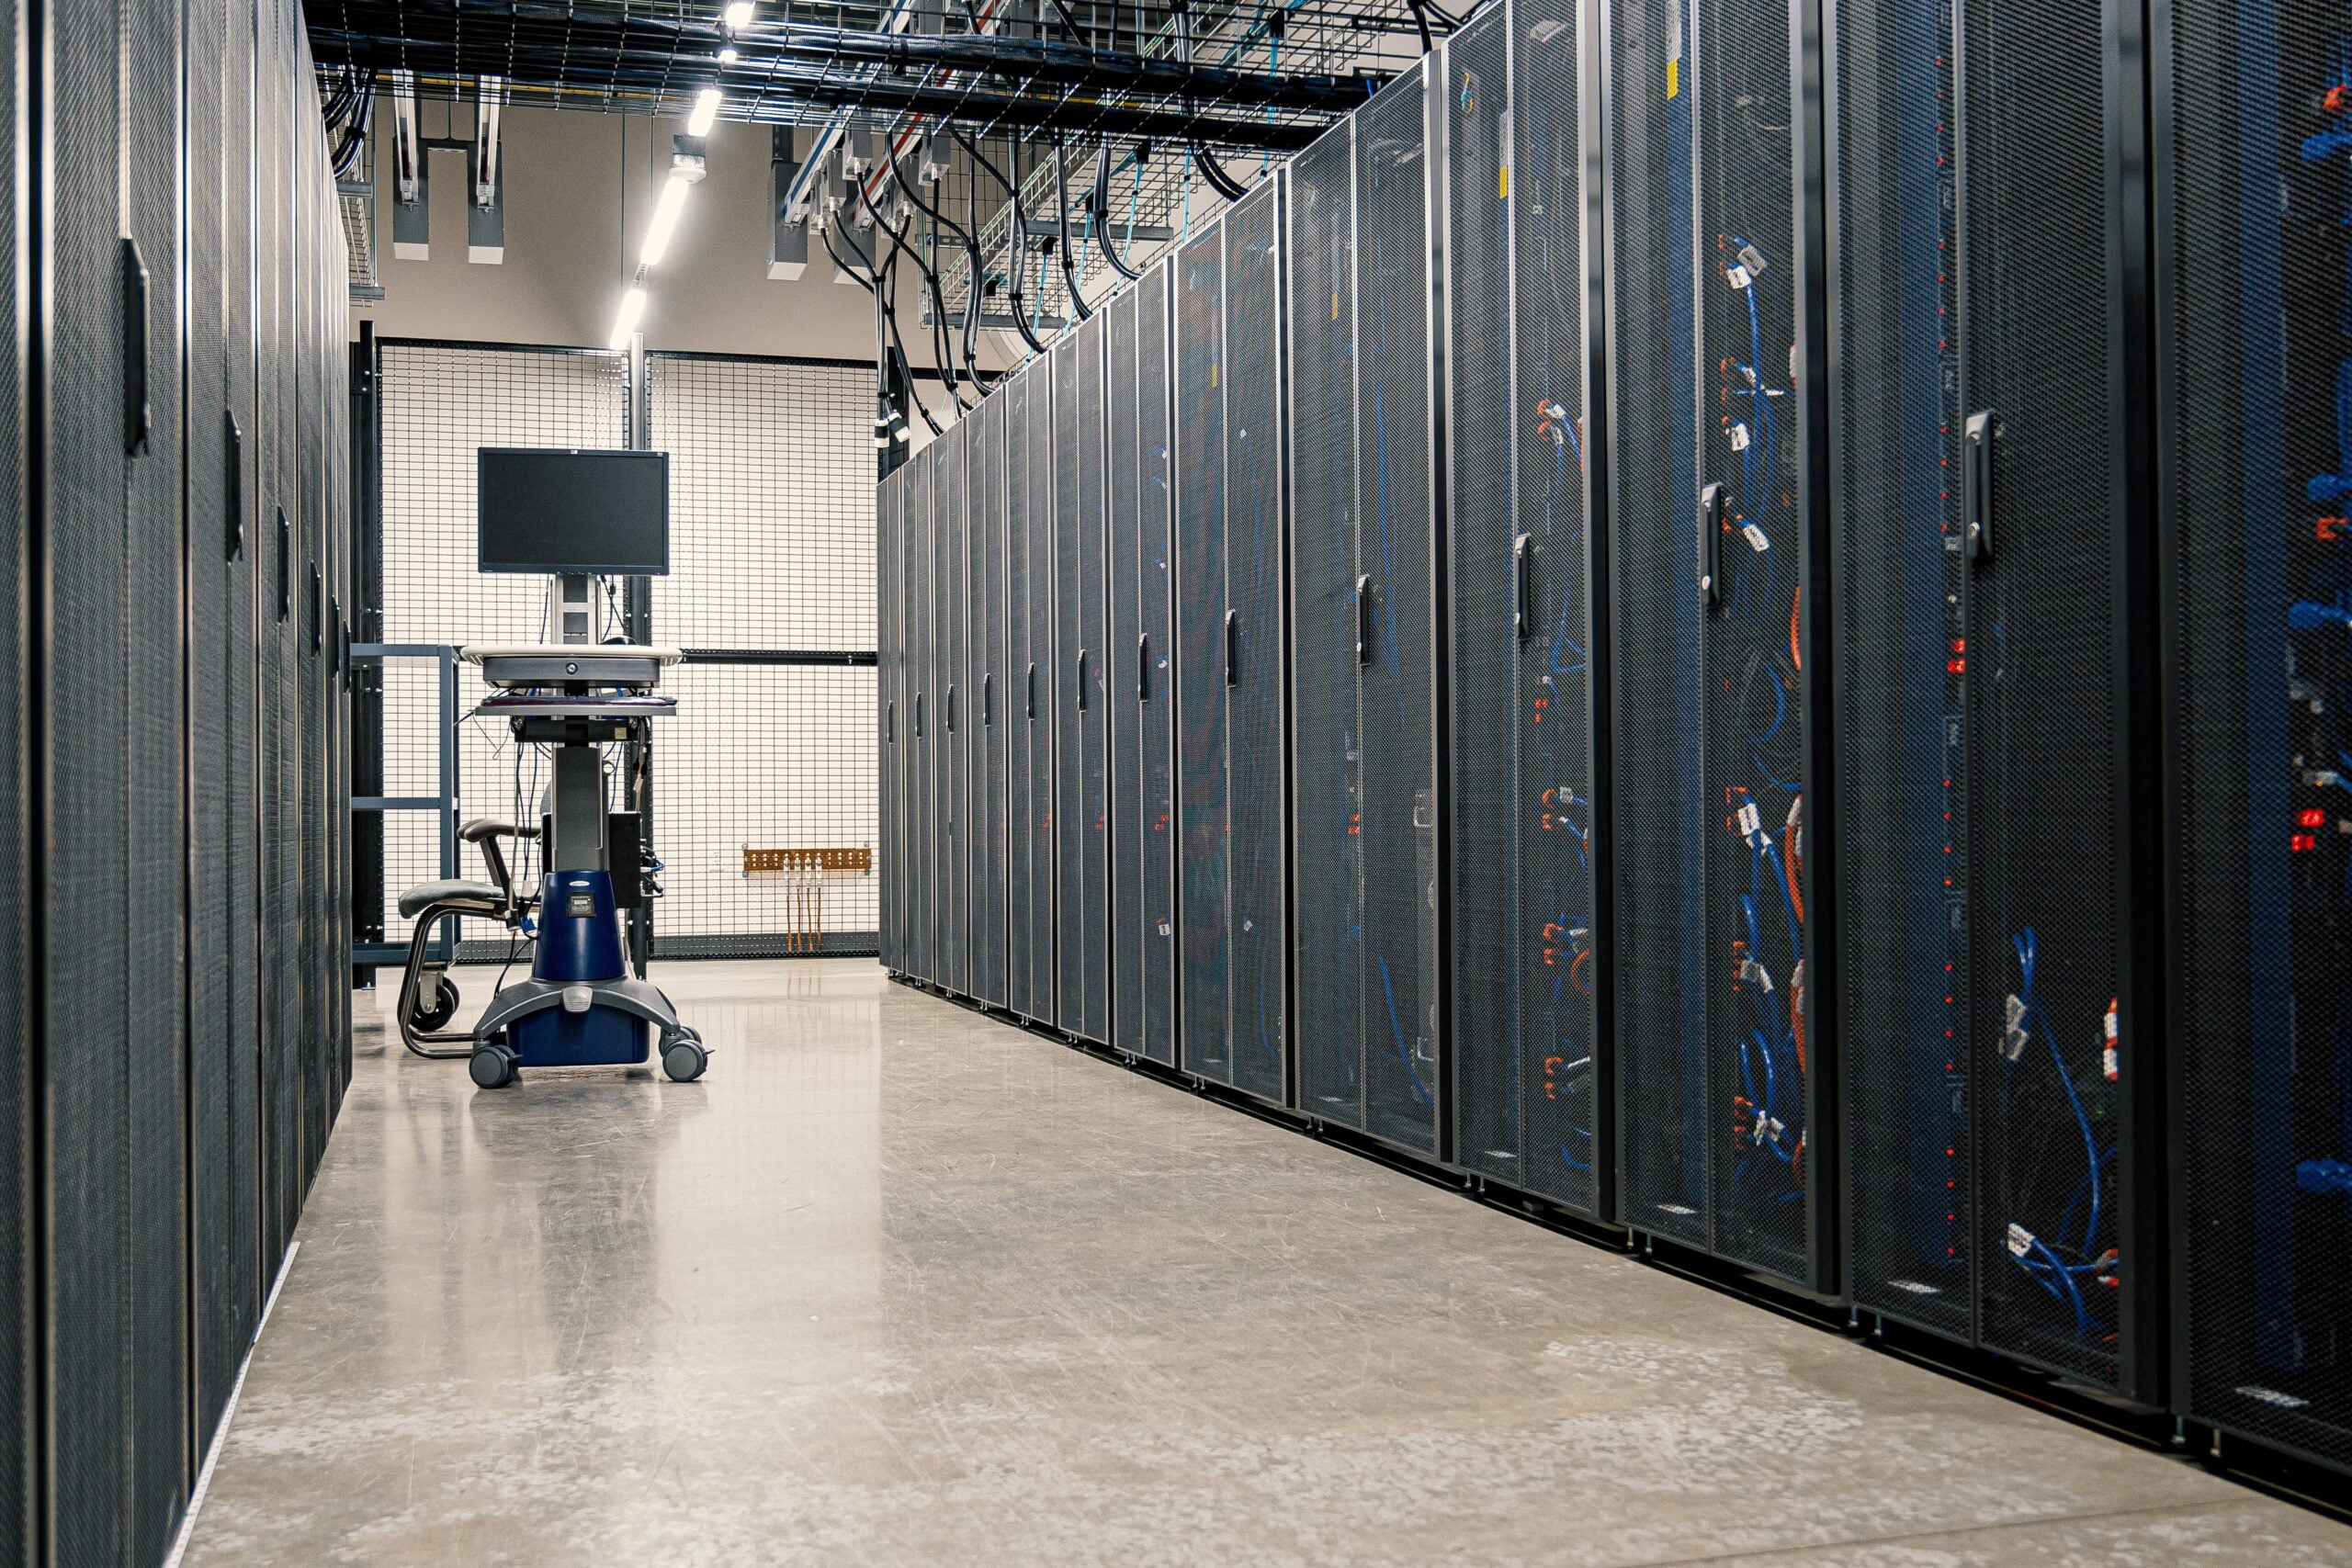
Capacity planning uses the data in another way. Engineers need headroom above the expected peak, geographic distribution that reduces latency, and recovery plans for failed components.
The public counter may show demand, but the invisible question is whether the service can absorb the next surge without delaying game state or account updates.
Responsible interpretation combines technical and behavioral measures. Concurrency describes simultaneous presence; it does not prove satisfaction, spending, or long-term loyalty. Used beside retention, session length, and service reliability, it becomes a valuable signal rather than a misleading verdict.
Cloudflare’s guide to load balancing explains why traffic distribution is an engineering concern as well as an analytical one. Platforms need spare capacity before a peak arrives, not after a counter begins flashing red.
Good interpretation combines several measures
Concurrent counts become far more useful besides table occupancy, average session length, return frequency, and geographic distribution. Together, those measures can show whether growth comes from more visitors, longer visits, or better concentration at peak times.
Reporting should preserve that uncertainty. A counter can be described as an estimate, a sampled value, or a live connection total without becoming less useful.
Precise definitions make comparisons stronger because analysts can separate genuine audience changes from a revised counting method, delayed update, or temporary infrastructure event.
The counter is still valuable. It provides the pulse. But a pulse is not a full diagnosis, and online table games are too varied to be understood through one number alone.
